
The most widely cited study on the effect of cell phone usage on traffic accidents is this one by Redelmeier and Tibshirani in the New England Journal of Medicine. Their conclusion is that talking on the phone leads to a fourfold increase in accident risk.
Their method is interesting. It’s called a case crossover design, and it works like this. We want to know the odds ratio of an accident when you talk on the phone versus when you don’t. Let’s write it like this, where 


But we have no way of estimating numerator or denominator from traffic accident data because we would need to know the counterfactuals of how often people drive (with and without talking on the phone) and don’t have accidents. Case crossover studies are based on a little algebraic trick which transforms the odds ratio into something we can estimate, with just a little more data. Using Bayes’ rule and two lines of algebra, we can rewrite it like this.
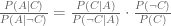
From accident data we can estimate the first term on the right-hand-side. We just calculate the fraction of accidents in which someone was talking on the phone. The finesse comes in when we estimate the second term. We don’t want to just estimate the overall frequency of cell phone use because we estimated the first term using a selected sample of people who had accidents. They may be different from the population as a whole. We want the cellphone usage rates for the people in our sample.
Case crossover studies take each person in the data who had an accident and ask them to report whether they were talking on the phone while driving at the same time of day one week before. Thus, each person generates their own control case. It’s a valid control because its the same person, driving at the same time, and on average therefore under the same conditions. These survey data are used to estimate the second term.
It’s really clever and its used a lot in epidemiological studies. (People get sick, some were exposed to some potential hazard, others not. The method is used to estimate the increase in risk of getting sick due to being exposed to the hazard.)
I have never seen it in economics however. In fact, this was the first I ever heard of it. So its natural to wonder why. And it doesn’t take long before you see that it has a serious weakness when applied to data with a lot of heterogeneity.
To see the problem, suppose that there are two types of people. The first group, in addition to being generally accident prone are also easily distracted. Everyone else is a safe driver and talking on cellphones doesn’t make them any less safe. Then our sample of people who actually had accidents would consist disproportionately of the first group. We would be estimating the effect of cell phone use on them alone. If they make up a small fraction of the population then we are drastically overestimating the increase in risk.
It’s fair to say that at best we can use the estimate of 4 as an upper bound on the risk ratio averaging over the entire population. That population average could be zero and still be consistent with the findings from case crossover studies. And there is no simple way to remedy the problems with this method. So I think there is good reason to approach this question from a different direction.
As I described before, if cell phone distractions increase accident risk we would see it by comparing the population of drivers to drivers with hearing impairment, who don’t use cell phones. And it turns out that the data exist. In the NHTSA’s database of traffic accidents, there is this variable:
P18 Person’s Physical Impairment
Definition: Identifies physical impairments for all drivers and non-motorists which may have contributed to the cause of the crash.
And “deaf” is impairment number 9.

5 comments
Comments feed for this article
October 13, 2010 at 2:01 am
itovertakesme
I love hearing about your ideas as they unfold! Maybe this will turn out to be a really useful paper!
October 13, 2010 at 7:19 am
Sean
Deaf people can still use a cell phone to text/twitter/e-mail, I suspect their cell phone ownership rates are similar to hearing people (pure speculation). Separate and apart from this issue, it’s also entirely possible that deaf drivers are better/worse drivers than hearing drivers when not using a cell phone and/or when they are using a cell phone.
I’m not sure what you’d get out of comparing population accident rates, I think you would need additional controls.
October 19, 2010 at 1:32 pm
Skylar
A friend and former professor of mine directed me to your question. I’d like to pursue the empirical analysis of this question! I’ll keep you apprised of results.
December 5, 2010 at 6:53 am
קארטינג
i loved the math involved.. The statictics that were made really refelect the analysis..
December 29, 2010 at 3:01 am
business mobile packages
קארטינג
I like your article and your statistical report about the effect of cell phone usage on traffic accidents.