
Thursday night we had another overtime game in the NBA finals. For the sake of context, here is a plot of the time series of point differential. Orlando minus LA.

A few of the commenters on the previous post nailed the late-game strategy behind the eye-popping animation. First, at the end of the game, the team that is currently behind will intentionally foul in order to prevent the opponent running out the clock. The effect of this in terms of the histogram is that it throws mass out away from zero. But the ensuing free-throws might be missed and this gives the trailing team a chance to close the gap. So the total effect of this strategy is to throw mass in both directions.
If the trailing team is really lucky both free throws will be missed and they will score on the subsequent possession and take the lead. Now the other team is trailing and they will do the same. So we see that at the end of the game, no matter where we are on that histogram, mass will be thrown in both directions, until either the lead is insurmountable, or we land right at zero, a tie game.
Once the game is tied there is no more incentive to foul. But there is also no incentive to shoot (assuming less than 24 seconds to go.) The leading team will run the clock as far as possible before taking one last shot.
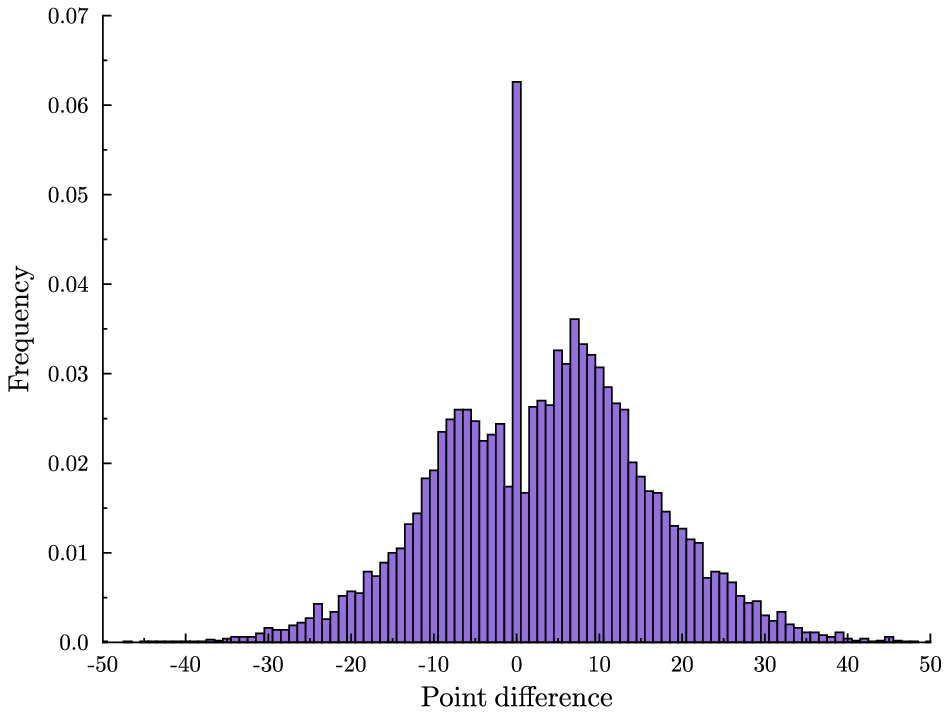
So there are two reasons for the spike: risk-taking strategy by the trailing team increases the chance of landing at a tie game, and then conservative strategy keeps us there. The following graphic (again due to the excellent Toomas Hinnosaar) illustrates this pretty clearly.
 In blue you have the distribution of point differences that we would get if we pretented that the teams’ scoring was uncorrelated. This is what I referred to as the crude hypothesis in the previous post. In red you see the extra mass from the actual distribution and in white you see the smaller mass from the actual distribution. We see that the actual distribution is more concentrated in the tails (because there is less incentive to keep scoring when you are already very far ahead), less concentrated around zero (because of risk-taking by the trailing team) and much more concentrated at the point zero (because of conservative play when the game is tied.)
Now, this is all qualitatively consistent with the end-of-regulation histogram and with the animation. The big question is whether it can explain the size of that spike quantitatively. Obviously, not all games that go into overtime follow this pattern. For example, Thursday’s game did not feature intentional fouling at the end. How can we assess whether sound strategy alone is enough to explain the frequency of overtime?

3 comments
Comments feed for this article
June 13, 2009 at 10:37 am
Ben
One more thing to consider: In the game on Thursday the Lakers (trailing) were down by 3 will 12 seconds. In addition to playing aggresively as described, they will also ONLY take three pointers in the last 10 seconds since time gets too short to do a two-pointer, foul , two-pointer sequence. As a result, if down three with limited time, the distribution of outcomes will be say 20 percent tie, 80 percent three point loss (or larger if they foul again).
June 16, 2009 at 9:49 am
mpowell
Regarding the plausibility of the high number of ties, I don’t thinking about strategy alone is going to help you much. You need to know more about the specifics of basketball play at the NBA level. For example, if you are down by 1 and foul with 10 seconds left, what chance do you have to tie? It is easy to determine the distribution of free throw results, but then we need to know the % chance of a tying 2 or 3, down by the same, with time running out. I think you need to get accurate information on that before you can answer your question and general field goal percentages are not good enough- you need that specific end of game type data. And if you assume that teams will be smart and foul when they are up by 3 (obviously not guaranteed!), you need to know how much time that generally takes up, because it is an important element in determining the effectiveness of those types of strategies.
June 17, 2009 at 12:36 am
rd
Here’s a recent paper that’s relevant to this issue-http://papers.ssrn.com/sol3/papers.cfm?abstract_id=1377964
They found refs favor teams losing during games – but the favoritism doesn’t increase in the playoffs – but didn’t look closely at the overtime issue in particular